DA-bench
Visual Benchmark for Data Analytics AI Agents
Question V3:
Categorical Charts
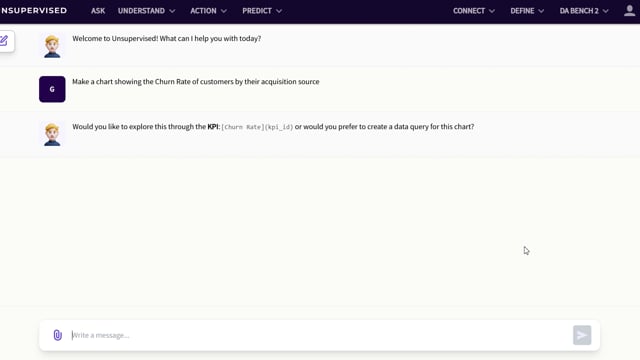
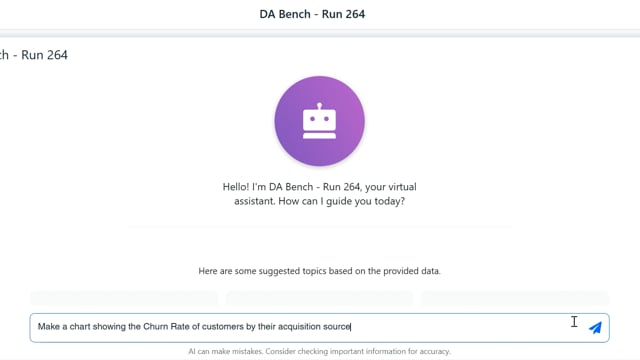
Prompt
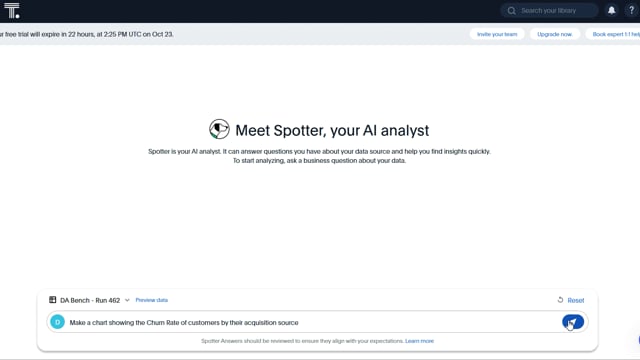
: Make a chart showing the Churn Rate of customers by their acquisition source
Category
:
Datasets
: Telco
Latest Results
Tool
Score
Timestamp
Video Recording
unsupervised
-5
X
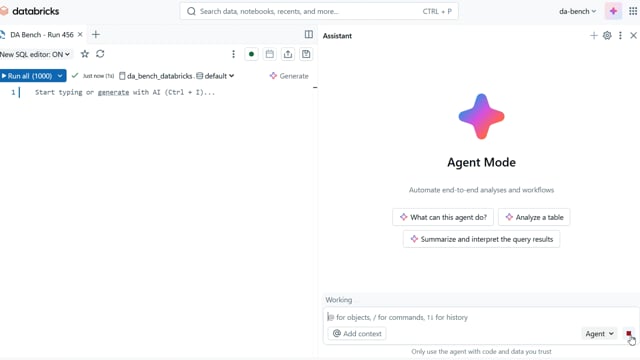
databricks
4
X
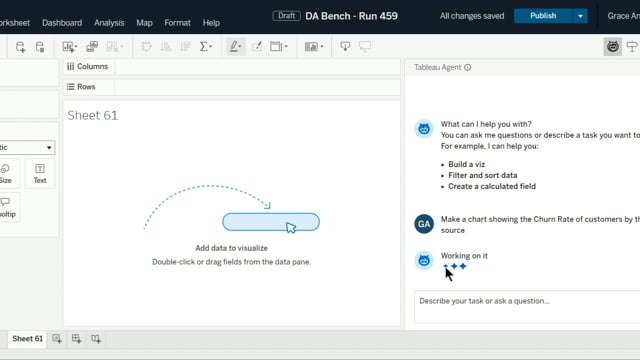
tableau
5
X
snowflake
4
X
chatgpt
5
X
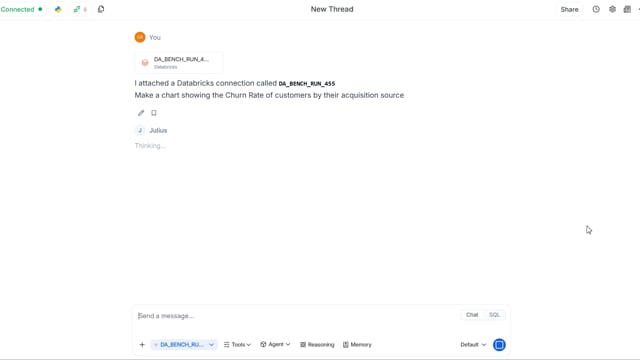
julius
-5
X
microstrategy
0
X
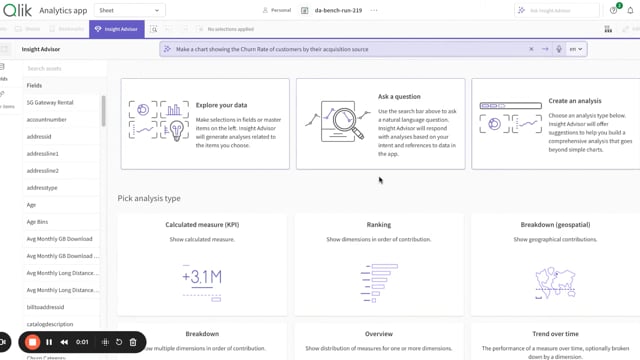
qlik
0
X
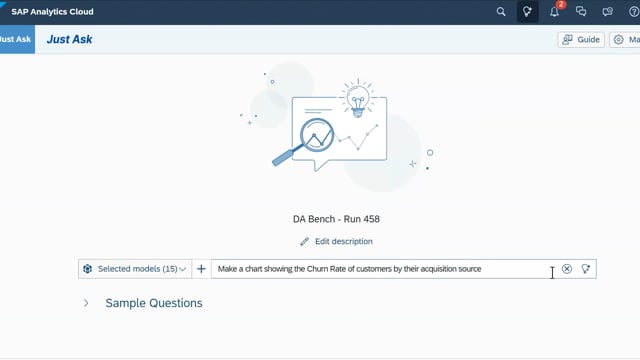
sap
0
X
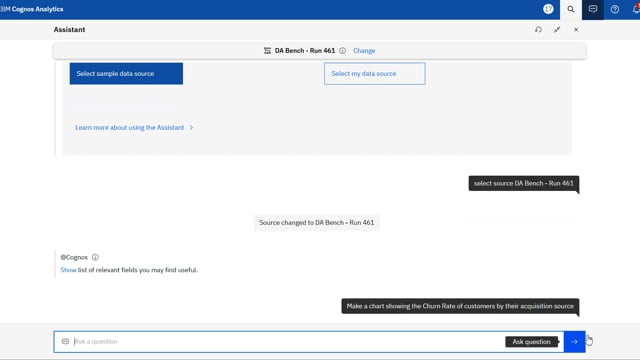
ibm
0
X
quicksight
0
X
bigquery
4
X
genie
-5
X
cortex
0
X
spotter
5
X